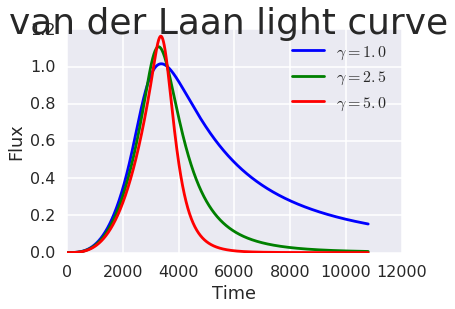
Van Der Laan
From A Model for Variable Extragalactic Radio Sources, (Van Der Laan 1969).
See class documentation for more details: simlightcurve.curves.vanderlaan.VanDerLaan
In [1]:
import matplotlib.pyplot as plt
import numpy as np
import seaborn
In [2]:
%matplotlib inline
seaborn.set_context('poster')
seaborn.set_style("darkgrid")
In [3]:
from simlightcurve import curves

energy_index_1 = 1.
energy_index_2 = 2.5
energy_index_3 = 5.
maximum_flux = 1.
maximum_time = 60. * 60.

vdl1 = curves.VanDerLaan(amplitude=maximum_flux,
                          energy_index=energy_index_1,
                          t0=maximum_time
                          )

vdl2 = curves.VanDerLaan(amplitude=maximum_flux,
                          energy_index=energy_index_2,
                          t0=maximum_time
                          )

vdl3 = curves.VanDerLaan(amplitude=maximum_flux,
                          energy_index=energy_index_3,
                          t0=maximum_time
                          )

time_steps = np.arange(0., 3. * maximum_time, 1.)
In [4]:
fig, axes = plt.subplots(1,1)
fig.suptitle('van der Laan light curve', fontsize=36)
ax=axes
ax.set_xlabel('Time')
ax.set_ylabel('Flux')
for model in (vdl1, vdl2, vdl3):
    ax.plot(time_steps, model(time_steps),
            label='$\gamma={}$'.format(model.energy_index.value),
#             ls='--',
           )
plt.legend()
Out[4]:
<matplotlib.legend.Legend at 0x7f2e84534080>