Powerlaw curves
In [1]:
import matplotlib.pyplot as plt
import numpy as np
import seaborn
/usr/lib/python3/dist-packages/matplotlib/font_manager.py:273: UserWarning: Matplotlib is building the font cache using fc-list. This may take a moment.
  warnings.warn('Matplotlib is building the font cache using fc-list. This may take a moment.')
/usr/lib/python3/dist-packages/matplotlib/font_manager.py:273: UserWarning: Matplotlib is building the font cache using fc-list. This may take a moment.
  warnings.warn('Matplotlib is building the font cache using fc-list. This may take a moment.')
In [2]:
%matplotlib inline
seaborn.set_context('poster')
seaborn.set_style("dark")
In [3]:
from simlightcurve import curves


hr = 60*60
decay_tau=1.*24*hr
rise_tau=decay_tau*0.3
t_min = 0.1
break_one_t_offset = 0.2*decay_tau

unbroken_pl = curves.Powerlaw(init_amp=1,
                              alpha_one=-0.5,
                              t_offset_min=t_min,
                              t0=None)

offset_pl = curves.Powerlaw(init_amp=1,
                            alpha_one=-0.5,
                            t_offset_min=t_min+1.0,
                            t0=-10
                            )

broken_pl = curves.SingleBreakPowerlaw(init_amp=.1,
                            alpha_one=-0.2,
                            break_one_t_offset=break_one_t_offset,
                            alpha_two=-0.8,
                            t_offset_min=t_min,
                            t0=None
                            )


tsteps = np.linspace(t_min, decay_tau, 1e5, dtype=np.float)
In [4]:
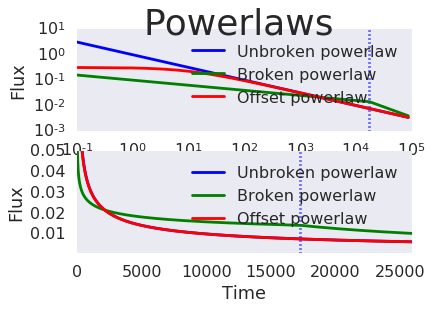
fig, axes = plt.subplots(2,1)
fig.suptitle('Powerlaws', fontsize=36)
ax=axes[0]
# ax.axvline(0, ls='--')
ax.axvline(break_one_t_offset, ls=':')
ax.set_xlabel('Time')
ax.set_ylabel('Flux')
ax.plot(tsteps, unbroken_pl(tsteps), label='Unbroken powerlaw')
ax.plot(tsteps, broken_pl(tsteps), label='Broken powerlaw')
ax.plot(tsteps, offset_pl(tsteps), label='Offset powerlaw')
ax.set_yscale('log')
ax.set_xscale('log')
# ax.set_ylim(0.001,.1)
# ax.set_xlim(t_min, 0.8*decay_tau)
ax.legend()

ax=axes[1]
# ax.axvline(0, ls='--')
ax.axvline(break_one_t_offset, ls=':')
ax.set_xlabel('Time')
ax.set_ylabel('Flux')
ax.plot(tsteps, unbroken_pl(tsteps), label='Unbroken powerlaw')
ax.plot(tsteps, broken_pl(tsteps), label='Broken powerlaw')
ax.plot(tsteps, offset_pl(tsteps), label='Offset powerlaw')
# ax.set_yscale('log')
# ax.set_xscale('log')
ax.set_ylim(0.001,.05)
ax.legend()
ax.set_xlim(t_min, 0.3*decay_tau)

# plt.gcf().tight_layout()
Out[4]:
(0.1, 25920.0)