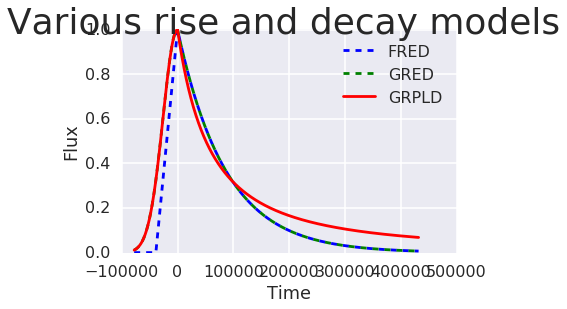
General rise and decay curves
Various curves named after their rise and decay functions.
In [1]:
import matplotlib.pyplot as plt
import numpy as np
import seaborn
In [2]:
%matplotlib inline
seaborn.set_context('poster')
seaborn.set_style("darkgrid")
In [3]:
from simlightcurve import curves

hr = 60*60
decay_tau=1.*24*hr
rise_tau=decay_tau*0.3
t1_offset = decay_tau

fred = curves.LinearExp(
    amplitude=1.0,
    rise_time=rise_tau*1.5,
    decay_tau=decay_tau,
    t0=None
)

gred = curves.GaussExp(
            amplitude=1.0,
            rise_tau=rise_tau,
            decay_tau=decay_tau,
            t0=None
)

grpld = curves.GaussPowerlaw(
    amplitude = 1.0,
    rise_tau=rise_tau,
    decay_alpha=-1.5,
    decay_offset=decay_tau,
    t0=None
)

tsteps = np.arange(-rise_tau*3, decay_tau*5, 30)
In [4]:
fig, axes = plt.subplots(1,1)
fig.suptitle('Various rise and decay models', fontsize=36)
ax=axes
# ax.axvline(0, ls='--')
# ax.axvline(t1_offset, ls='--')
ax.set_xlabel('Time')
ax.set_ylabel('Flux')
ax.plot(tsteps, fred(tsteps), label='FRED', ls='--')
ax.plot(tsteps, gred(tsteps), label='GRED', ls='--')
ax.plot(tsteps, grpld(tsteps), label='GRPLD')
# ax.set_xscale('log')
# ax.set_yscale('log')
ax.set_ylim(1e-5,1.001)
ax.legend()
Out[4]:
<matplotlib.legend.Legend at 0x7f9d5e79eb00>